Strategy Tester Report
[ea]ShashiR2_MT4_v01d_MultiPair
AlpariUK-Demo (Build 226)
| Symbol | GBPUSD (Great Britain Pound vs US Dollar) | ||||
| Period | 1 Hour (H1) 2010.01.04 00:00 - 2010.04.16 00:00 (2010.01.01 - 2010.04.16) | ||||
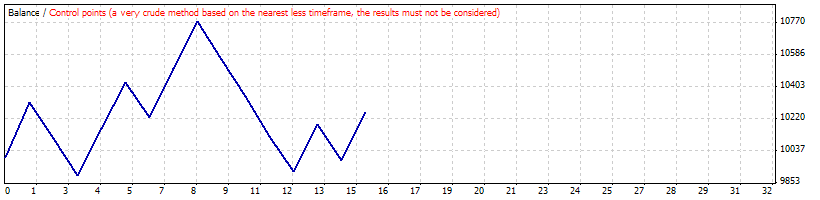
| Model | Control points (a very crude method, the results must not be considered) | ||||
| Parameters | WithTrend=false; Pairs=""AUDJPY,AUDNZD,AUDUSD,CHFJPY,EURAUD,EURCAD,EURCHF,EURGBP,EURJPY,EURUSD,GBPCHF,GBPJPY,GBPUSD,NZDJPY,NZDUSD,USDCAD,USDCHF,USDJPY""; Lots=0.2; ProfitMade=130; LossLimit=100; BreakEven=0; TrailStop=0; KillLogging=false; | ||||
| Bars in test | 2762 | Ticks modelled | 44844 | Modelling quality | n/a |
| Mismatched charts errors | 9 | ||||
| Initial deposit | 10000.00 | ||||
| Total net profit | 257.72 | Gross profit | 1935.40 | Gross loss | -1677.68 |
| Profit factor | 1.15 | Expected payoff | 17.18 | ||
| Absolute drawdown | 174.48 | Maximal drawdown | 923.80 (8.57%) | Relative drawdown | 8.57% (923.80) |
| Total trades | 15 | Short positions (won %) | 6 (50.00%) | Long positions (won %) | 9 (44.44%) |
| Profit trades (% of total) | 7 (46.67%) | Loss trades (% of total) | 8 (53.33%) | ||
| Largest | profit trade | 313.60 | loss trade | -229.60 | |
| Average | profit trade | 276.49 | loss trade | -209.71 | |
| Maximum | consecutive wins (profit in money) | 2 (552.04) | consecutive losses (loss in money) | 4 (-858.60) | |
| Maximal | consecutive profit (count of wins) | 552.04 (2) | consecutive loss (count of losses) | -858.60 (4) | |
| Average | consecutive wins | 1 | consecutive losses | 2 | |
| # | Time | Type | Order | Size | Price | S / L | T / P | Profit | Balance |
| 1 | 2010.01.08 00:00 | buy | 1 | 0.20 | 1.59530 | 0.00000 | 0.00000 | ||
| 2 | 2010.01.08 00:00 | modify | 1 | 0.20 | 1.59530 | 1.58030 | 1.61330 | ||
| 3 | 2010.01.08 14:50 | close | 1 | 0.20 | 1.61098 | 1.58030 | 1.61330 | 313.60 | 10313.60 |
| 4 | 2010.01.14 00:00 | sell | 2 | 0.20 | 1.62648 | 0.00000 | 0.00000 | ||
| 5 | 2010.01.14 00:00 | modify | 2 | 0.20 | 1.62648 | 1.64148 | 1.60848 | ||
| 6 | 2010.01.14 18:20 | close | 2 | 0.20 | 1.63663 | 1.64148 | 1.60848 | -203.00 | 10110.60 |
| 7 | 2010.01.15 00:00 | sell | 3 | 0.20 | 1.63357 | 0.00000 | 0.00000 | ||
| 8 | 2010.01.15 00:00 | modify | 3 | 0.20 | 1.63357 | 1.64857 | 1.61557 | ||
| 9 | 2010.01.19 01:50 | close | 3 | 0.20 | 1.64419 | 1.64857 | 1.61557 | -213.28 | 9897.32 |
| 10 | 2010.01.20 00:00 | sell | 4 | 0.20 | 1.63620 | 0.00000 | 0.00000 | ||
| 11 | 2010.01.20 00:00 | modify | 4 | 0.20 | 1.63620 | 1.65120 | 1.61820 | ||
| 12 | 2010.01.21 09:40 | close | 4 | 0.20 | 1.62271 | 1.65120 | 1.61820 | 268.48 | 10165.80 |
| 13 | 2010.01.25 00:00 | buy | 5 | 0.20 | 1.61363 | 0.00000 | 0.00000 | ||
| 14 | 2010.01.25 00:00 | modify | 5 | 0.20 | 1.61363 | 1.59863 | 1.63163 | ||
| 15 | 2010.01.26 02:20 | close | 5 | 0.20 | 1.62670 | 1.59863 | 1.63163 | 261.38 | 10427.18 |
| 16 | 2010.02.05 00:00 | buy | 6 | 0.20 | 1.57932 | 0.00000 | 0.00000 | ||
| 17 | 2010.02.05 00:00 | modify | 6 | 0.20 | 1.57932 | 1.56432 | 1.59732 | ||
| 18 | 2010.02.05 08:45 | close | 6 | 0.20 | 1.56930 | 1.56432 | 1.59732 | -200.40 | 10226.78 |
| 19 | 2010.02.08 00:00 | buy | 7 | 0.20 | 1.56251 | 0.00000 | 0.00000 | ||
| 20 | 2010.02.08 00:00 | modify | 7 | 0.20 | 1.56251 | 1.54751 | 1.58051 | ||
| 21 | 2010.02.10 11:20 | close | 7 | 0.20 | 1.57652 | 1.54751 | 1.58051 | 280.16 | 10506.94 |
| 22 | 2010.02.17 00:00 | sell | 8 | 0.20 | 1.57823 | 0.00000 | 0.00000 | ||
| 23 | 2010.02.17 00:00 | modify | 8 | 0.20 | 1.57823 | 1.59323 | 1.56023 | ||
| 24 | 2010.02.18 08:50 | close | 8 | 0.20 | 1.56457 | 1.59323 | 1.56023 | 271.88 | 10778.82 |
| 25 | 2010.02.25 00:00 | buy | 9 | 0.20 | 1.54358 | 0.00000 | 0.00000 | ||
| 26 | 2010.02.25 00:00 | modify | 9 | 0.20 | 1.54358 | 1.52858 | 1.56158 | ||
| 27 | 2010.02.25 05:20 | close | 9 | 0.20 | 1.53259 | 1.52858 | 1.56158 | -219.80 | 10559.02 |
| 28 | 2010.02.26 00:00 | buy | 10 | 0.20 | 1.52837 | 0.00000 | 0.00000 | ||
| 29 | 2010.02.26 00:00 | modify | 10 | 0.20 | 1.52837 | 1.51337 | 1.54637 | ||
| 30 | 2010.02.26 14:02 | close | 10 | 0.20 | 1.51797 | 1.51337 | 1.54637 | -208.00 | 10351.02 |
| 31 | 2010.03.01 00:00 | buy | 11 | 0.20 | 1.51818 | 0.00000 | 0.00000 | ||
| 32 | 2010.03.01 00:00 | modify | 11 | 0.20 | 1.51818 | 1.50318 | 1.53618 | ||
| 33 | 2010.03.01 11:15 | close | 11 | 0.20 | 1.50670 | 1.50318 | 1.53618 | -229.60 | 10121.42 |
| 34 | 2010.03.02 00:00 | buy | 12 | 0.20 | 1.50237 | 0.00000 | 0.00000 | ||
| 35 | 2010.03.02 00:00 | modify | 12 | 0.20 | 1.50237 | 1.48737 | 1.52037 | ||
| 36 | 2010.03.02 02:20 | close | 12 | 0.20 | 1.49231 | 1.48737 | 1.52037 | -201.20 | 9920.22 |
| 37 | 2010.03.26 00:00 | buy | 13 | 0.20 | 1.48391 | 0.00000 | 0.00000 | ||
| 38 | 2010.03.26 00:00 | modify | 13 | 0.20 | 1.48391 | 1.46891 | 1.50191 | ||
| 39 | 2010.03.29 08:50 | close | 13 | 0.20 | 1.49719 | 1.46891 | 1.50191 | 265.58 | 10185.80 |
| 40 | 2010.04.01 00:00 | sell | 14 | 0.20 | 1.51770 | 0.00000 | 0.00000 | ||
| 41 | 2010.04.01 00:00 | modify | 14 | 0.20 | 1.51770 | 1.53270 | 1.49970 | ||
| 42 | 2010.04.01 13:37 | close | 14 | 0.20 | 1.52782 | 1.53270 | 1.49970 | -202.40 | 9983.40 |
| 43 | 2010.04.02 00:00 | sell | 15 | 0.20 | 1.52944 | 0.00000 | 0.00000 | ||
| 44 | 2010.04.02 00:00 | modify | 15 | 0.20 | 1.52944 | 1.54444 | 1.51144 | ||
| 45 | 2010.04.06 12:20 | close | 15 | 0.20 | 1.51568 | 1.54444 | 1.51144 | 274.32 | 10257.72 |